Exploring Parabolas
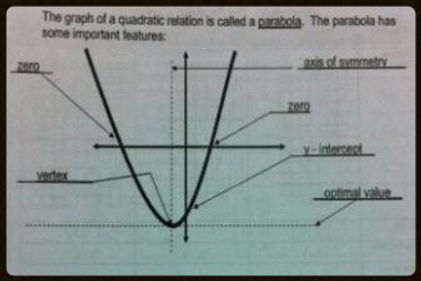
In order for us to understand the mathematical concept of "quadratics", we need to first look at and understand the fundamental basics that it entails. Just like a straight-line depicts a linear relationship, a "parabola" depicts a "quadratic relationship". The "parabola" is an element which is common throughout the entire quadratics unit, and thus, is an excellent starting point in our venture to understand and grasp the concept of "quadratics". Below is a labelled diagram which depicts the different parts of a "parabola".

Axis of Symmetry: It is the line that divides the parabola in two EQUAL sections. The "axis of symmetry" will always be an x-value, more specifically, it will be the x-value of the vertex. Thus, when you are writing the "axis of symmetry", you would write it as an x-value (i.e., x=7).
x-intercepts ("zeroes" or "roots"): It is the point on the graph, where the parabola crosses the x-axis. When you are writing an "x-intercept", you would write it as a point (i.e., -3,0 and 4,0). Sometimes, depending on your parabola, you can have a single x- intercept, two x-intercepts, or perhaps even none.
Vertex: It is the maximum or minimum point on the graph (depending on the direction your parabola opens). It is the point where the graph changes direction. Since the vertex is a POINT on the graph, it should also be written as one (i.e., 4,0).
y-intercept: It is where the parabola crosses the y-axis. When you are writing a "y-intercept", you would write it as a point (i.e., 0,5 and 0,-9).
Optimal Value: It is either the highest point or the lowest point on your parabola, depending on the direction your parabola opens. The "optimal value" will always be a y-value, more specfically, it will be the y-value of the vertex.
